
Manufacturers and testing laboratories are always seeking fast, simple, and accurate analytical techniques to perform deformulation, contamination, and good versus bad analysis. Evolved Gas Analysis (EGA), the rapid screening technique using the vertical micro and multi-mode furnace, is widely used as the 1st step in performing deformulation or comparative analyses. EGA provides a clear picture about the thermal profile of a sample as well as the optimal temperature zones for performing any further analysis such as Thermal Desorption (TD), Heart Cutting (HC), or Flash Pyrolysis (PY) using the multi-mode pyrolyzer.
To Perform EGA, a short and deactivated tube connects the GC injection port to MS. The sample is dropped into a relatively low temperature. The furnace is then programmed to a much higher temperature. Compounds “evolve” continuously from the sample as the temperature is increasing. A plot of detector response versus furnace temperature is then obtained.
The second step is to analyze the thermal zones of interest obtained from EGA thermogram. In this step referred to as Heart-Cutting EGA-MS (HC), the Selective Sampler slices a thermal zone out of the sample and separates the components chromatographically using a Mass Spectrometer (MS).
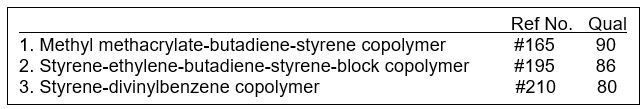
Fig. 1 shows the EGA of printer toner and the average spectra of temperature regions A, B, and C of the thermogram. Judging from the elution temperatures, zones A and B are originating from the desorption of low molecular weight compounds. Zone C is considered arising from the thermal decomposition of polymers. Using the F-Search EGA-MS library, various styrene copolymers were identified for region C (shown in Table 1).
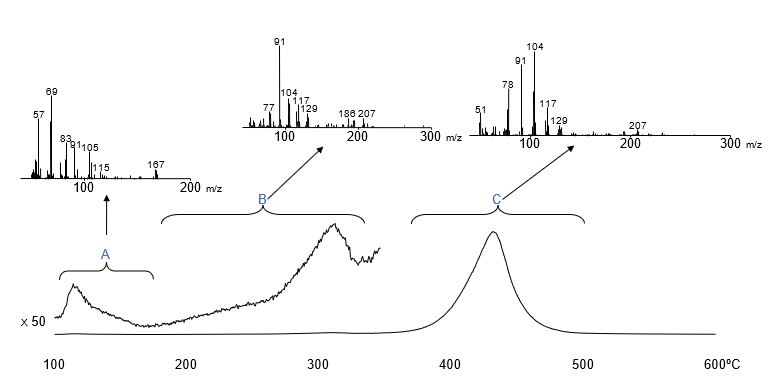
Fig. 1 EGA Curve of Printer Toner and Mass Spectra of Each Region
Using the HC mode of operation, components in each temperature region are introduced into a GC column and trapped at the front of the column using Selective Sampler and MicroJet Cryo-Trap. They are then separated by GC and analyzed by MS. Using this technique, analysis of components in each peak allows detailed characterization of the sample’s composition. Fig. 2 shows the chromatograms of evolved gases in regions A, B, and C of the EGA curve of printer toner.
A variety of nitrile compounds were found in region A, and region B contained methyl methacrylate (MMA) in addition to various aromatics such as styrene (S), styrene dimer (SS), and styrene trimer (SSS). Thermal decomposition products of styrene-methyl methacrylate copolymer were detected in region C.
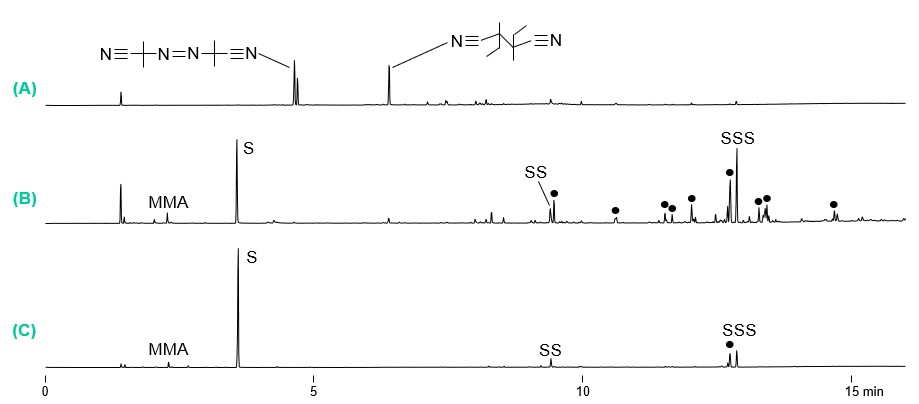
Fig. 2 Chromatograms of Each Temperature Region of the EGA Thermogram
To learn more about the multi-mode pyrolyzer and its application for deformulation and contamination analysis, simply connect with us or visit us at www.frontier-lab.com